Executive Salaries
June 2019 - Results
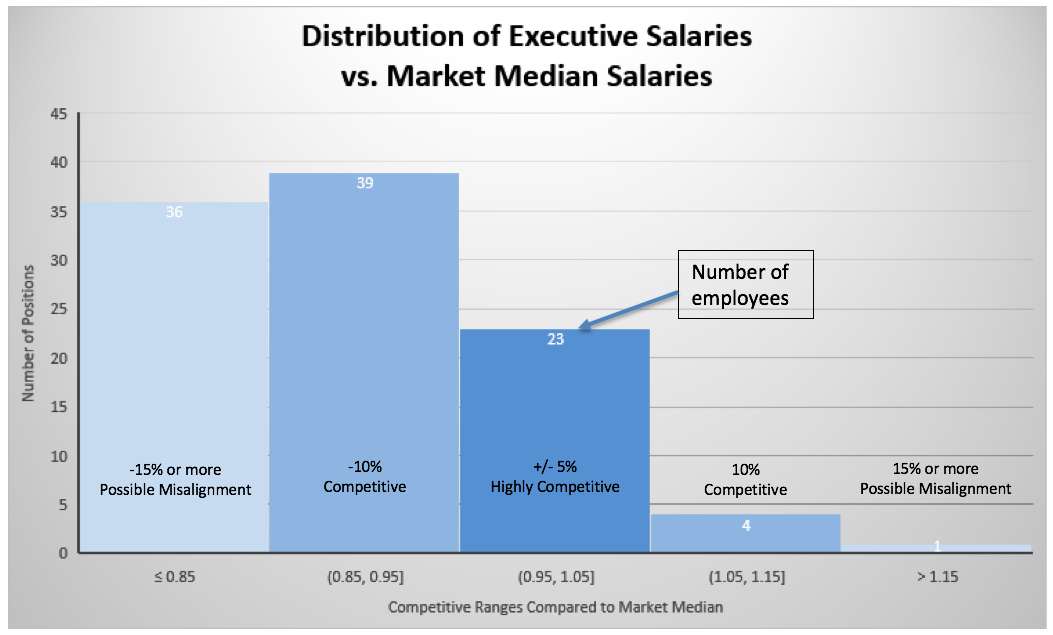
Across the system salaries for officers and senior administrators are, on average, -6% of the market median by position.
Where we are:
- The market analysis for executive positions is complete
What we know:
- Overall, executive salaries are 13% below market median, resulting in compression, and potential recruiting challenges and risk of loss
Next steps:
- Strengthen market benchmarking methodology to clarify which positions are classified as executive for institutional consistency
- Adopt new salary range structure to include administrative guidelines for placement based on market, education, experience, and performance
Methodology and Survey Sources
UA worked with Quatt Associates to review University of Alaska peer groups for both university-specific and system-wide executive positions
Salary data was collected from the following surveys:
- CUPA-HR Administrators in Higher Education Surveys
- CUPA-HR Professionals in Higher Education Surveys
- Western Management EduComp Survey
- Economic Research Institute (ERI) Executive Compensation Assessor
- Association of College and University Auditors Salary Survey
- Quatt Not-for-Profit Survey
The 3% annual adjustment (aging) was applied to each survey source.
Executive Salary FAQ
See the attached spreadsheet for peer institutions. EXCEL FILE